Interconnection 101: Clearing the Path for New Power
The United States must rapidly deploy new sources of reliable, affordable, and clean power to meet rising electricity demand from data centers, industrial growth, and the electrification of multiple sectors. Whether the power comes from nuclear, natural gas, geothermal, or other sources, every new project must navigate the grid interconnection process, which is the biggest bottleneck for deploying all types of infrastructure.
Interconnection is the process of connecting a new energy facility to the electric grid. You can think of the interconnection process in two steps: first, a study, and second, the physical connection for commercial operation.
In the first step, grid operators study how a proposed project will affect electricity flows across the entire grid system, assess reliability impacts, and determine whether grid upgrades are needed and their costs. These can include building new transmission lines, rebuilding transmission lines to be higher voltage, or reconductoring of existing lines, as well as deploying new equipment at substations or onto other parts of the system to ensure reliability. The interconnection study process takes over three years on average, with some parts of the country taking nearly five years on average. Then, step two, the actual physical connection, can take an additional two to four years. This inefficient process results in less than 20% of proposed projects reaching commercial operation.
Interconnection is Slowing Down Energy Addition
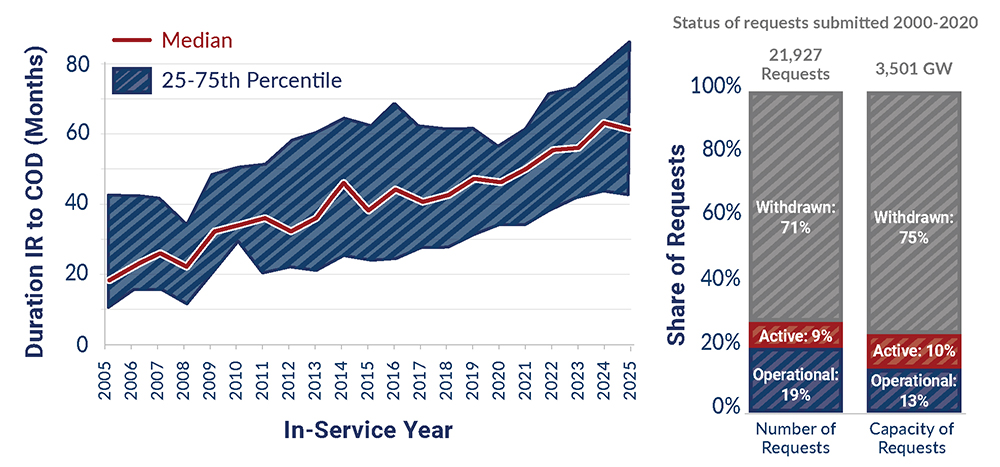
Source: LBNL. (2026). Queued Up 2026 Data File.
The main cause of this bottleneck is a disconnect between three critical processes:
- Generation interconnection, which brings electricity supply onto the grid.
- Demand (Load) interconnection, which connects electricity consumers and increases system demand.
- Transmission planning, which evaluates and identifies the grid infrastructure needed to ensure reliability, reduce congestion, and meet future energy needs.
These processes are deeply interdependent, yet they are often planned and executed in isolation. This misalignment leads to delays, higher costs, and missed opportunities to efficiently align supply, demand, and infrastructure.
Addressing these challenges requires a multi-pronged approach that can:
- Maximize existing grid capacity;
- Integrate transmission planning with generation and load growth; and
- Leverage innovation to accelerate studies and grid connection
Together, these reforms can help unlock the full potential of the existing project pipeline, reduce timelines, and ensure the grid can support continued economic growth. Addressing siting, permitting, and supply chain bottlenecks will also be essential to building a grid capable of meeting rising demand.
1. Maximize existing grid capacity
Making better use of the existing grid is one of the fastest, lowest-cost ways to bring new power online. Instead of waiting years for new transmission to be built, there are other ways projects can connect to and use the grid. Three approaches can tap into existing capacity to make their electrons available to the grid faster: energy-only service, surplus interconnection service, and generator replacement.
- Energy-only transmission service
Some energy projects seek full deliverability of their power on the transmission system, meaning they reserve capacity and are willing to pay for the infrastructure to support delivery. Other projects, however, may be willing to accept energy-only transmission service, allowing them to deliver power when transmission capacity is available, without firm capacity rights.
The benefit of this energy-only service is that these projects can connect to the grid without needing major network upgrades, which lowers costs and speeds up the connection process. However, these projects take on the risk that the system is full or congested, and their energy is therefore curtailed. ERCOT successfully uses this model, enabling faster, higher project completion rates for all types of energy technologies.In other regions, however, grid operators often study these projects as if they seek deliverability, triggering unnecessary upgrades that increase costs and timelines. Aligning studies to project service needs can unlock faster, lower-cost connections. Projects can also transition from energy-only service to having full deliverability over time, allowing them to operate while upgrades are being built. - Surplus interconnection
Most interconnection points are underutilized because generators don’t run at full capacity all of the time, or even most of the time. For example, over 200 GW of generation on the grid today is designed to serve peak load periods, meaning that for much of the year, these points of interconnection are underutilized. Co-locating new projects, such as natural gas peakers, with existing solar projects can maximize use of this infrastructure, avoiding grid upgrades and saving time and costs. Streamlining these requests and proactively identifying opportunities can further accelerate energy deployment.
- Generator replacement
When an existing energy project retires, the point of interconnection it utilized and any capacity rights should be expeditiously reallocated to a new project or projects. Proactively developing the procedure is the critical first step and should be designed to prioritize projects that fully utilize capacity and can be rapidly built and connected. By minimizing the time this grid capacity remains underutilized, transmission providers can ensure resource adequacy needs are met and that efficient market entry and exit are achieved, thereby promoting affordability.
Transmission providers can also consider allowing replacement projects to be located somewhere other than the retiring plant, provided the new location offers electrically equivalent grid access and capacity rights. The Midwest Independent System Operator made this change last year.
The Federal Energy Regulatory Commission (FERC) has laid the groundwork for these interconnection pathways through Order 2023, which updated the interconnection process in 2023 to operate in a first-ready, first-served study process for clusters of projects, and Order 845, which established surplus interconnection service in 2018. However, implementation by utilities and Regional Transmission Organizations (RTOs) can lead to study approaches and processes that inhibit their effective use, leaving prime speed to power opportunities off the table. In response, some RTOs have proactively amended their implementation of surplus interconnection service to remove barriers and accelerate energy additions, and more utilities and RTOs should follow suit to address reliability and affordability.
Additionally, FERC can identify and direct utilities and RTOs to remedy deficiencies that are unjust, unreasonable, unduly discriminatory or preferential through a Federal Power Act Section 206 proceeding. This approach enables FERC to identify specific deficiencies in a utility’s or RTO’s procedures and require revisions to address them, promoting more just and reasonable rates and regulations. It is faster than rulemaking and can improve these pathways to remove market barriers, helping get more electrons onto the grid faster.
2. Integrate transmission planning with generation and load growth
The siloing of interconnection processes from transmission planning is a core challenge. Today, information about the timing and cost of transmission and other network upgrades comes after a project enters the interconnection process and at the end of the multi-year long study process. This incentivizes developers to submit many projects, knowing that most will be withdrawn when they realize it will take too long or cost too much to interconnect a project. This creates delays and restudies for other projects whose study results are interdependent with other projects in the queue. Integrating information about the cost of connecting into the transmission system and when that capacity will be available at the beginning of the interconnection process can reduce uncertainty and enable more efficient allocation of scarce grid capacity.
Allocating this capacity can take many forms, such as project scoring criteria, entry-fee models, or open seasons. Regardless of the specific method different utilities or grid operators pursue, it’s essential to allocate capacity on a technology-neutral basis to projects that meet strict commercial-readiness requirements and financial commitments to accelerate energy deployment. These can include take-or-pay provisions for transmission capacity to reflect that projects will have greater certainty about timing and cost for interconnection. They could also eliminate grace periods for energy projects to reach commercial operation after the interconnection agreement is reached. This would help ensure that projects that are not commercially ready to build within three years of getting the go-ahead don’t prevent others from using available transmission capacity.
Proactive transmission planning is also essential. As demand grows, new transmission, not just generation, is required to maintain reliability and move power to customers. Equally important is coordinating generation and load interconnection. Today, they are studied separately, missing opportunities for shared infrastructure. In Ohio, for example, a 1.5 GW gas plant withdrew after facing $1.3 billion in grid upgrade costs, even as data center growth drove similar transmission needs in the region. An integrated approach could align investments, lower costs, and improve certainty for both generators and large loads.
Grid Access Impacts Connection Speed
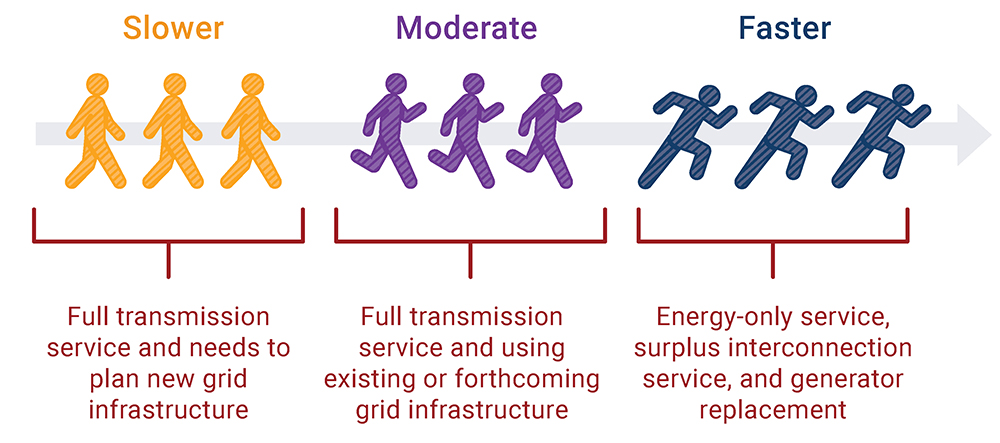
This approach to interconnection is similar to how runners organize themselves for a race. Assuming all projects are prepared for the race with their permits, site control, equipment and workforce contracts, and financial offtake ready to go, the projects that run faster will be those that can more quickly connect to the grid at their desired service level. The fastest projects would be those seeking energy-only service, surplus interconnection service, or generator replacement. Projects that can utilize existing transmission capacity or are planning to build in areas where new transmission capacity is under development may move at a more moderate pace. Meanwhile, projects that want full transmission deliverability but will need new infrastructure to be studied, planned, and built to meet their needs will move more slowly. By sorting projects by how quickly they can obtain their desired grid access and aligning their interconnection process to reflect only the studies and steps necessary to support their desired grid access, more energy can be added to the grid efficiently.
Grid operators can follow in California and SPP’s lead in prioritizing the efficient allocation of existing and forthcoming transmission capacity to provide greater cost and timing certainty to energy projects. FERC could also initiate a rulemaking to streamline interconnection processes for projects seeking full deliverability into areas with existing or forthcoming transmission capacity. This proceeding could also break down silos across large-load and generation interconnections to identify more efficient, cost-effective grid solutions.
3. Leverage innovation to accelerate studies and grid connection
Modernizing interconnection studies through automation and artificial intelligence (AI) is a clear near-term opportunity. Today, engineers spend significant time manually validating and updating data, creating and solving models, identifying grid upgrades to address constraints, and generating reports on the studies. Because these steps are fragmented and completed manually, they introduce more opportunities for human error and make replicating results challenging and time-consuming. Automation can dramatically reduce timelines. For example, the regional transmission operator in the Midwest, MISO, demonstrated how automation reduced its Phase One study from 686 days to 10 days, or from two years to just over one week. These time savings were made while achieving over 99% accuracy and minimal changes in the estimated grid upgrade costs for projects. In addition to the benefits of automation, new software tools leverage more advanced computational processes that can drastically reduce the time it takes to complete computations. All together, these tools allow engineers to spend more time applying their expertise than conducting manual data and model manipulation.
In addition to AI and automation, data-sharing must also improve. Today’s fragmented, email-based exchanges of information create delays due to the lack of timely access to accurate and up-to-date system information, leading to restudies. Notably, MISO’s computer systems completed the analysis in only 0.3 days, indicating a significant opportunity to further reduce study time through improved data-sharing practices.
Scaling these tools nationwide could transform interconnection timelines. While some operators have begun adopting them, all transmission providers should prioritize deploying software that improves speed, cost, and accuracy. FERC could require all transmission providers to issue a Request for Proposal (RFP) for software tools that improve the speed, cost, and accuracy of interconnection study processes. Utilities and RTOs will be able to evaluate all innovations on the market and select the tools that best fit their needs, or demonstrate that their current process and toolset are sufficient.
Another opportunity to better leverage innovations is in the deployment of advanced transmission technologies to upgrade the grid for new energy projects. Today, FERC regulations only require transmission providers to evaluate alternative transmission technologies that can enhance the performance of the existing infrastructure or replace existing equipment to increase capacity and efficiency, such as through reconductoring with advanced conductors. Transmission providers have sole discretion over whether to actually implement them. This means lower-cost, faster solutions may be underutilized.
To better support economic growth and lower consumer bills, FERC could update regulations to require providers to use these alternative technologies whenever they offer time or cost savings and meet all reliability standards. Furthermore, interconnection customers, who pay for network upgrades, should have the right to choose a solution so long as it meets all reliability standards.
Conclusion
Energy demand is growing, and the grid is not keeping pace. Growing the grid and addressing inefficient interconnection processes is crucial to economic growth, reliability, and energy affordability. These recommendations will let American energy move.